As part of our latest round of funding, we have created all new resources to help teach students about gravitational waves. In this blog post, I will introduce the new 3D models and how we went about designing them.
Gravitational Waves Produced by Back Hole Mergers
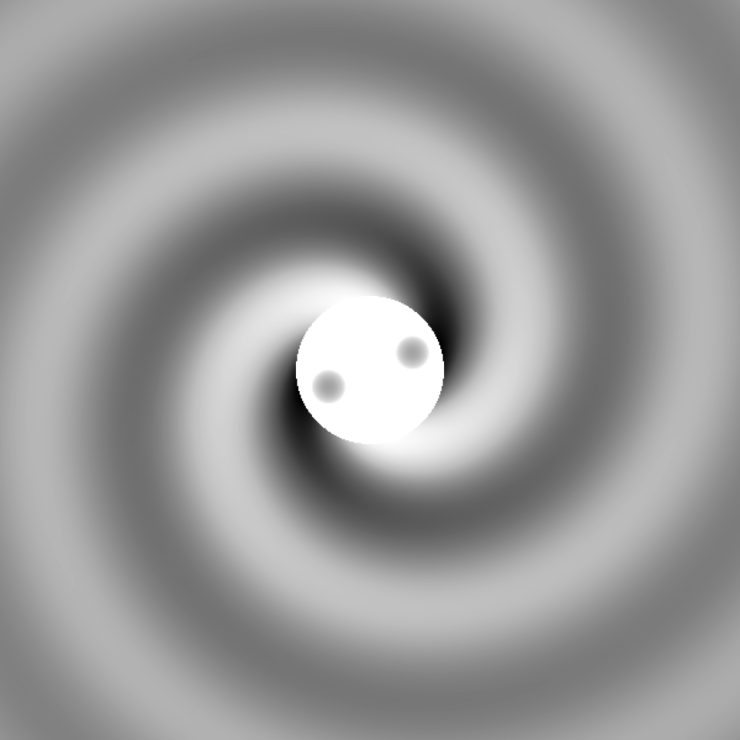
Once we decided to make resources for gravitational waves we knew we wanted to have a set of models showing the process of two black holes merging. After several discussions with our local gravitational wave researchers, we decided to create three models representing three times during the merger; the inspiral, the merger, and the ringdown. For each snapshot, we wanted to show the relative size and shape of the waves passing through spacetime.
To create these snapshots we had one of the ICG’s PhD students, Simone Mozzon, simulate the waves produced by two equal-mass merging black holes to use as a base (code provided by the Max Planck Institute for Gravitational Physics and the Simulating eXtreme Spacetimes collaboration). Simone then modified these wave patterns to include a flattened region in the middle with some half-sphere “dips” to represent the black holes. The size of these dips is proportional to the mass of the black holes, giving a tactile indicator of the mass increasing after the merger.
The code output top-down views of the central black holes and resulting gravitational waves as black and white images, and we were able to use our original Tactile Universe Blender plug-in to convert these into 3D printable tactile surfaces.

Introduction to Waves
While gravitational waves are cool and exciting they don’t mean much without first understanding what a wave is in the first place. To that end, we created a tactile graph of a simple wave with the amplitude and wavelength marked as tactile features.
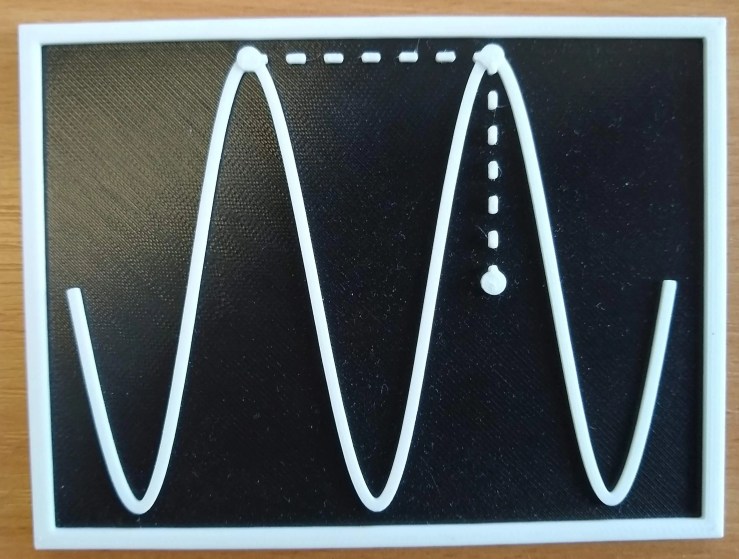
This graph is a little bit different from our typical tactile models. Unlike our older galaxy models or the black hole-black hole merger models we discussed above, this model only has three distinct heights for the tactile features. As a result, we were able to print these flat on the print bed and change the color of the filament part way through the print. For our kits, we decided to use black and white as our two colors to give maximum contrast.
To create this graph (and most of the other models below), I started with a Python script that saved the graphs as SVG files. These SVG files were read into Blender as vector paths and converted into 3D geometric objects. I then change the heights of each component to give the desired tactile effect. While a bit more time-consuming than using our plug-in for grayscale images, the end results look and feel much better.
How Objects Move in Gravity
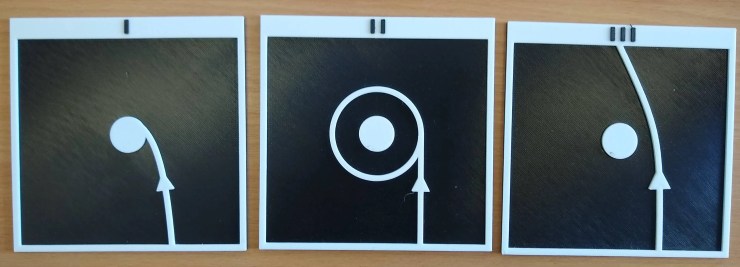
Up next we have some models to help explain how objects move in gravity. We start with a set of three models showing the “idealised” path a low-mass object takes when moving past a planet (or a black hole, or any other massive object) at various speeds. At low speeds the object will fall into the planet, at medium speeds the object will start orbiting the planet, and at fast speeds, the object’s path will be deflected, but it will continue past the planet.
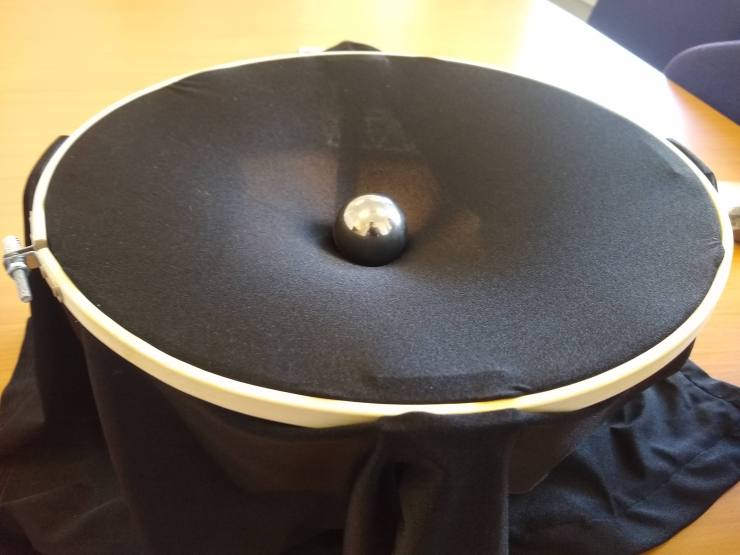
We also include in our kits a “fabric of space-time” model. This stretchy fabric can be used to simulate how space-time curves around massive objects. This model consists of some stretchy fabric held tight in an embroidery hoop. To hold the hoop in the air we use some wooden popsicle sticks held in place by some 3D printed brackets. Objects of varying mass can then be placed on the fabric to distort it to different degrees.

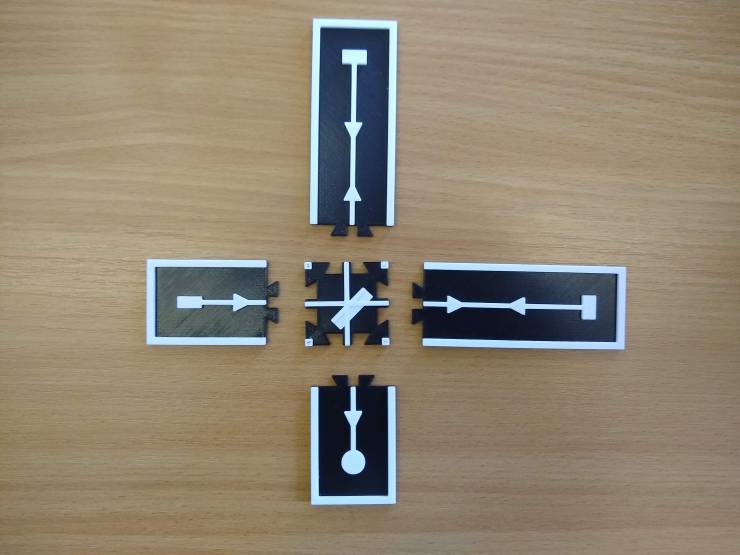
Detecting Gravitational Waves
With the concepts of waves and gravity having both been covered, the only thing left to talk about is how gravitational waves are detected. For this, we made a tactile diagram of a Michelson interferometer. This diagram tracks the path of light as it travels through the detector, but as this can be quite confusing from a tactile-only point of view, we decided to split the graph into 5 pieces that slot together like a puzzle. This enables the diagram to be built up piece by piece as the light travels along, avoiding introducing too much information in one go.